Optimization#
Why is optimization desirable?#
A technique that is commonly used for traditional tomographic reconstruction is filtered back projection. It consists of applying a ramp filter in frequency a.k.a. Ram-Lak (or other similar filter e.g. cosine, hanning, hamming, Shepp-Logan) to the Fourier transform of the acquired projection images before integration over angle. Filtration produces negative intensities in the projections such that when integrated the result is a perfect reconstruction with zero signal in the background. At present, there is no direct method to produce negative light intensity, therefore optimization with positively constrained intensity is required to reach a good solution for the set of projection images used for printing. (Aside: although there are chemical or holographic methods that could produce the outcome as if negative intensities were possible but these are substantially more advanced and have not yet been thoroughly proven.) However, filtering can still be used an effective initialization technique.
The side by side comparision shows a resolution target reconstructed from a sinogram that was only filtered and negative truncated (left) and from a sinogram that was optimized using the original CAL optimization scheme in [Kelly et al., 2019] (right).
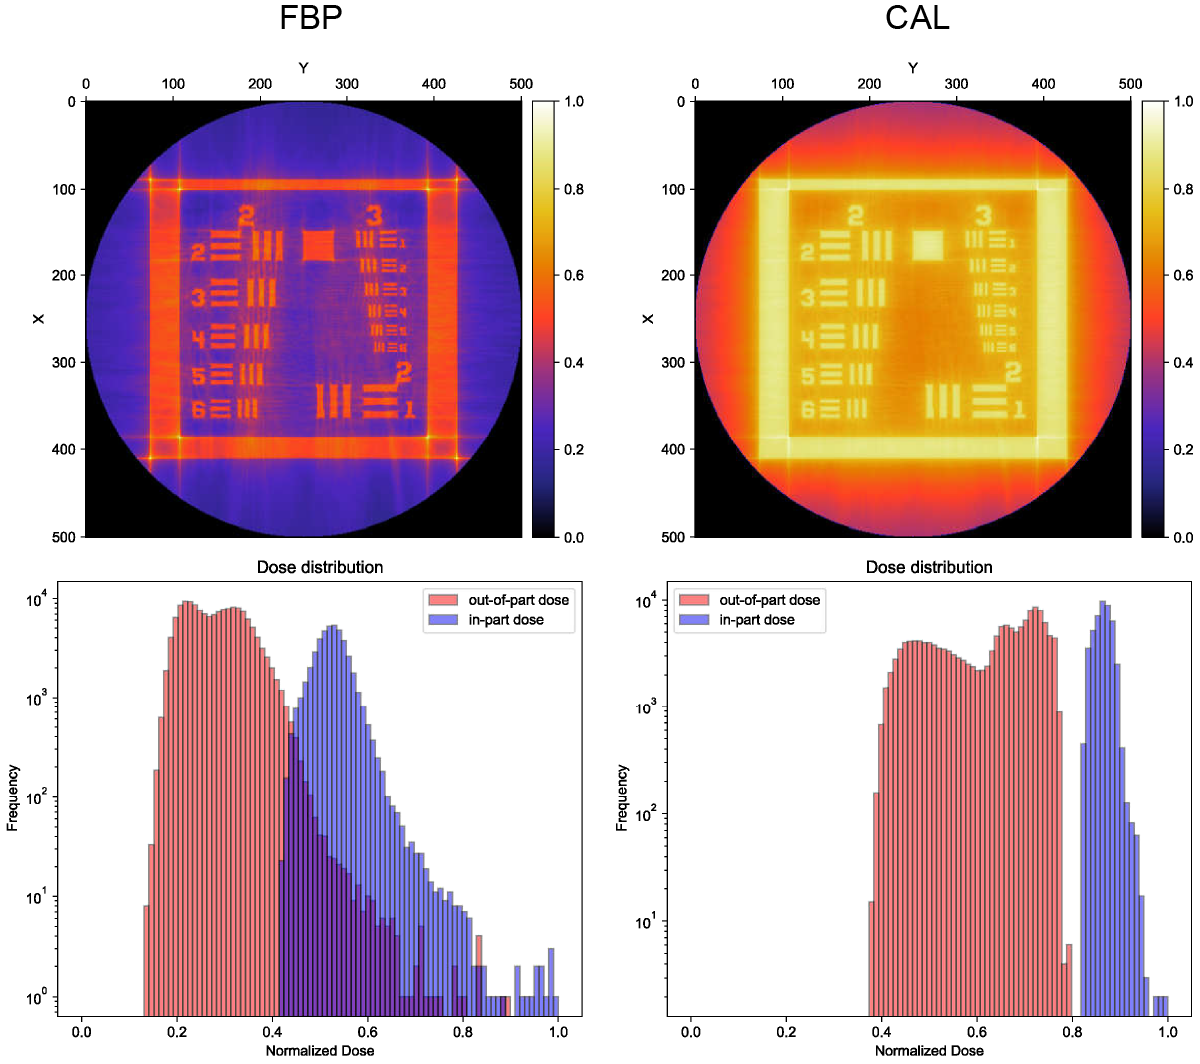
In the lower row, the reconstruction distrubtions are depicted on histograms. The red region represents values that lie outside the region of the target object and the blue region represents values that lie within the boundaries of target object. An ideal histogram for high contrast VAM printing has each of these in and out-of-part regions separated with no overlap. This means that no points outside of the boundary of the target object would polymerize before the points inside the boundary polymerized. In the left panel (FBP), there is substantial overlap between the distributions which indicates a poorly optimized reconstruction. In the right panel (CAL), the distributions are separated with no overlap which indicates a well optimized reconstruction.
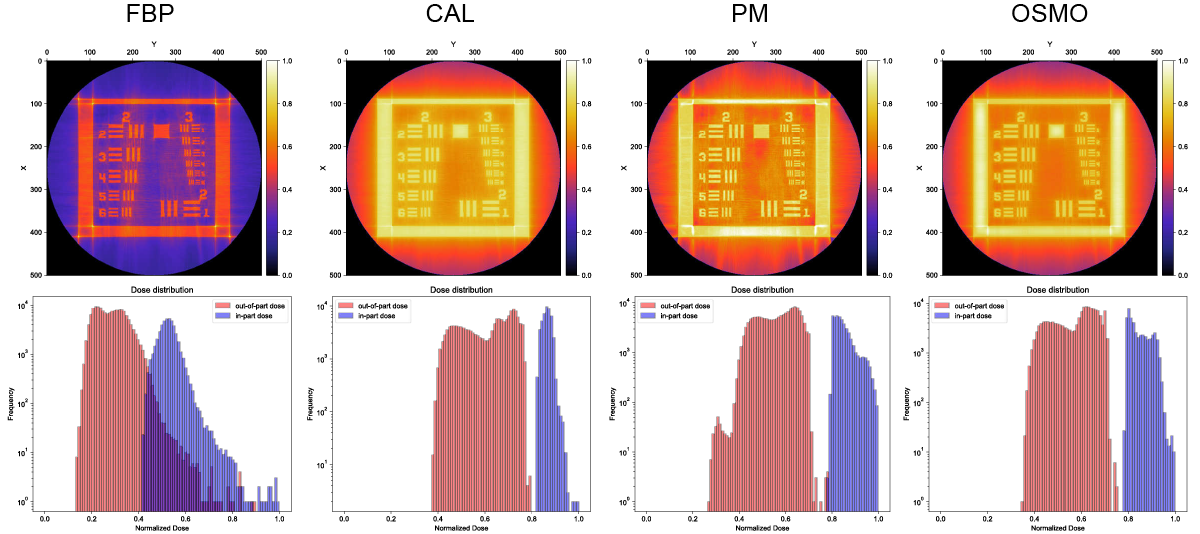
Optimization methods#
CAL by first order finite difference gradient descent
Penalty minimization (PM) by quasi-Newton BFGS
Object space model optimization (OSMO) by zeroth order minimization
Optimization plots#
If the verbose keyword argument is set to 'plot' in vamtoolbox.optimize.optimize, a group of plots that tracks the optimization process will appear. The top left plot is the mid slice of the target geometry array and the top right is the mid slice of the reconstruction array at the current iteration. The bottom left is a line plot of the error over past iterations and the bottom right is a histogram of the in- and out-of-part distributions at the current iteration as described above.
